Evolutionary Coupling Analysis
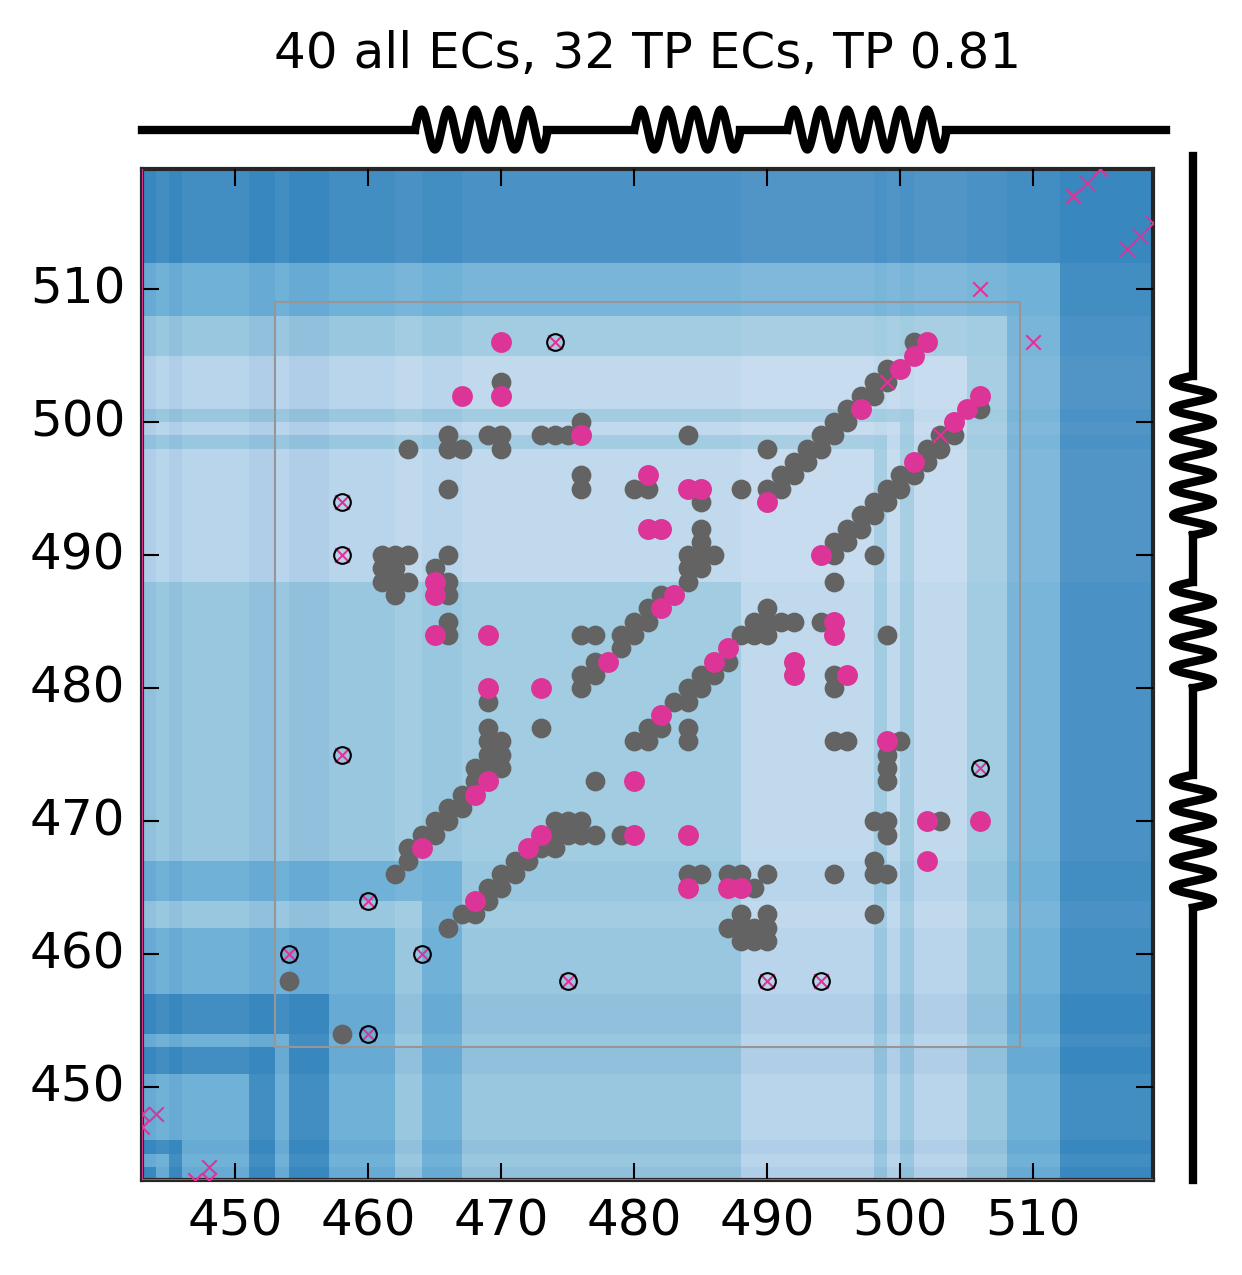
Predicted and experimental contacts
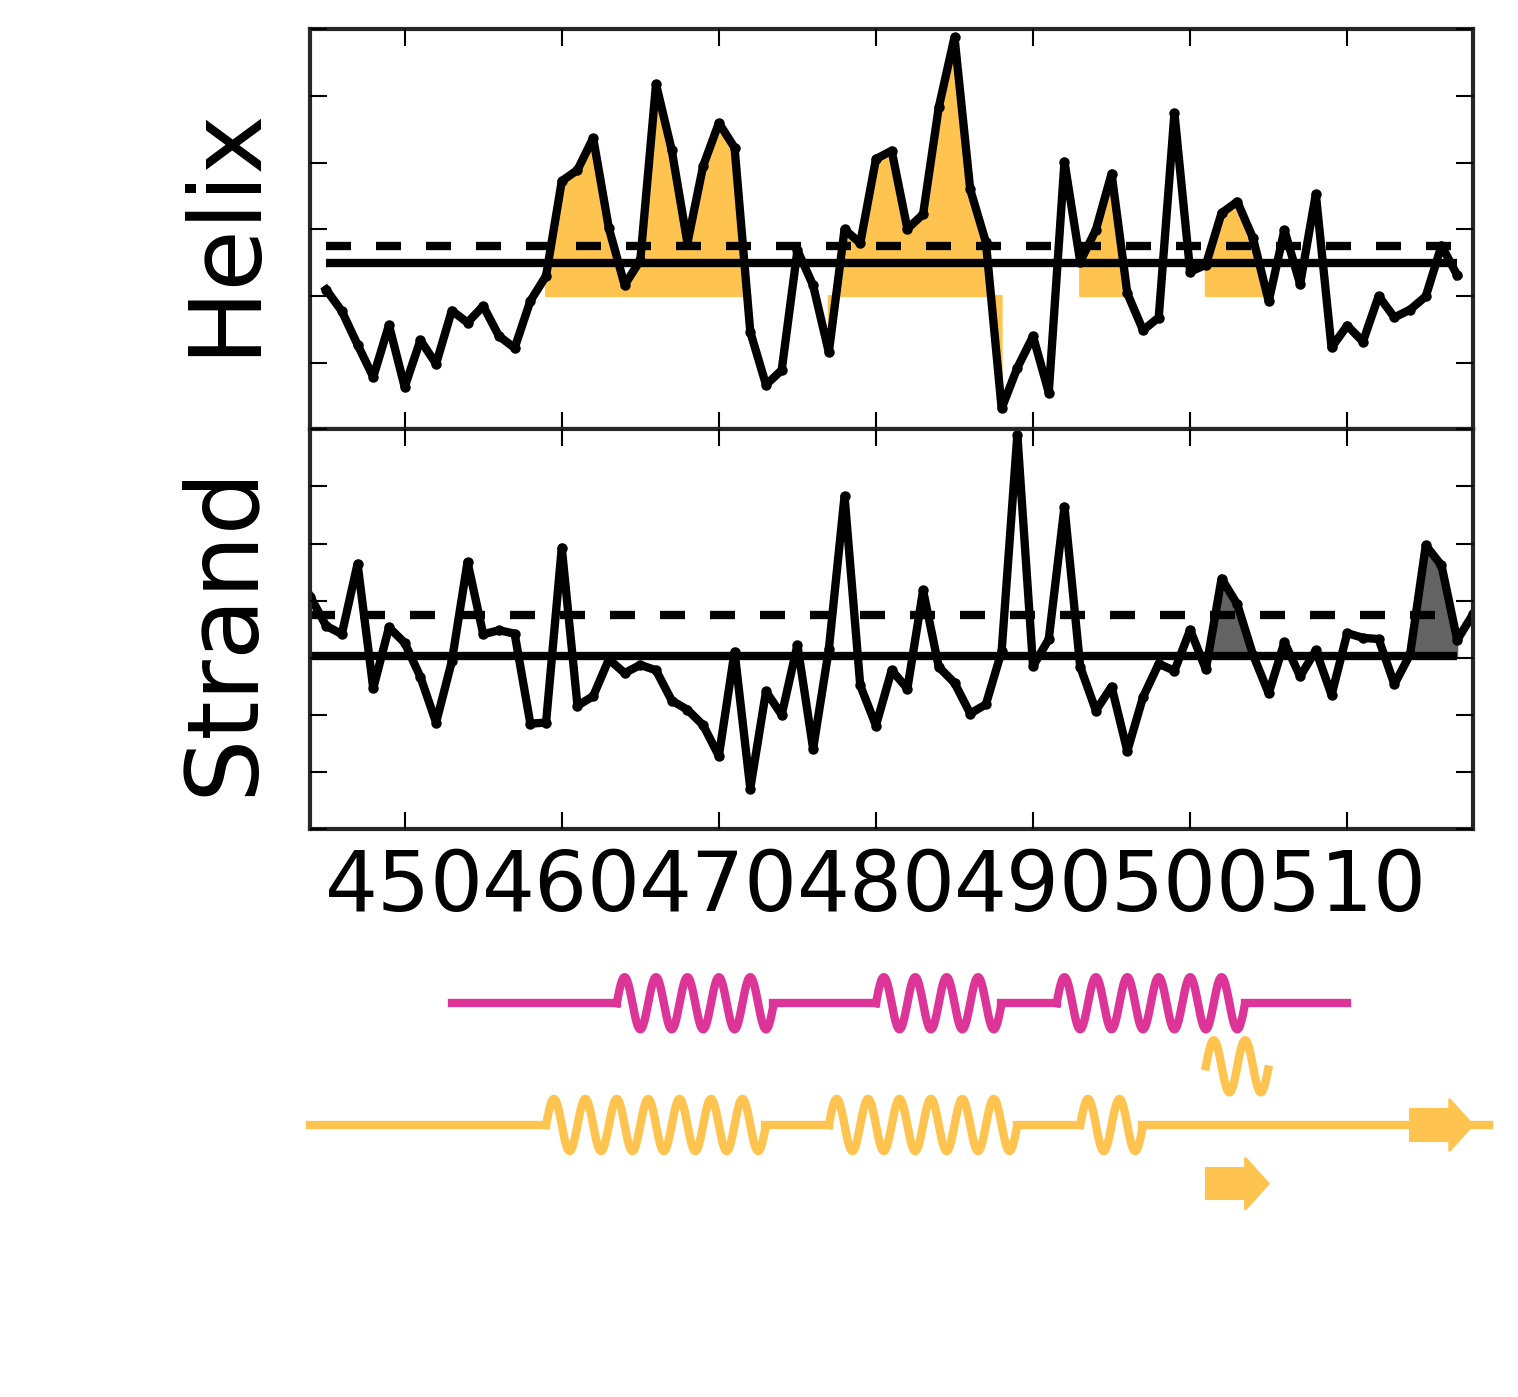
Secondary structure from ECs
EC score distribution and threshold
Top ECs
| Rank |
Residue 1 |
Amino acid 1 |
Residue 2 |
Amino acid 2 |
EC score |
| 1 |
470 |
W |
506 |
P |
1.47 |
| 2 |
467 |
E |
502 |
R |
1.42 |
| 3 |
469 |
Y |
480 |
D |
1.40 |
| 4 |
483 |
Q |
487 |
A |
1.24 |
| 5 |
481 |
I |
492 |
T |
1.17 |
| 6 |
465 |
P |
487 |
A |
1.13 |
| 7 |
497 |
D |
501 |
S |
1.10 |
| 8 |
458 |
P |
490 |
L |
1.08 |
| 9 |
481 |
I |
496 |
L |
1.04 |
| 10 |
473 |
H |
480 |
D |
0.95 |
| 11 |
485 |
S |
495 |
V |
0.94 |
| 12 |
506 |
P |
510 |
V |
0.82 |
| 13 |
484 |
L |
495 |
V |
0.82 |
| 14 |
514 |
D |
518 |
E |
0.80 |
| 15 |
469 |
Y |
473 |
H |
0.80 |
| 16 |
443 |
R |
447 |
E |
0.75 |
| 17 |
458 |
P |
494 |
Q |
0.75 |
| 18 |
482 |
P |
486 |
Q |
0.74 |
| 19 |
464 |
Q |
468 |
R |
0.73 |
| 20 |
490 |
L |
494 |
Q |
0.72 |
| 21 |
474 |
Q |
506 |
P |
0.68 |
| 22 |
500 |
D |
504 |
P |
0.67 |
| 23 |
482 |
P |
492 |
T |
0.67 |
| 24 |
465 |
P |
488 |
S |
0.66 |
| 25 |
515 |
E |
519 |
E |
0.65 |
| 26 |
470 |
W |
502 |
R |
0.63 |
| 27 |
444 |
S |
448 |
R |
0.63 |
| 28 |
476 |
L |
499 |
F |
0.63 |
| 29 |
460 |
P |
464 |
Q |
0.63 |
| 30 |
443 |
R |
448 |
R |
0.62 |
| 31 |
478 |
E |
482 |
P |
0.60 |
| 32 |
469 |
Y |
484 |
L |
0.59 |
| 33 |
458 |
P |
475 |
Q |
0.58 |
| 34 |
465 |
P |
484 |
L |
0.58 |
| 35 |
513 |
L |
517 |
E |
0.54 |
| 36 |
468 |
R |
472 |
A |
0.53 |
| 37 |
454 |
L |
460 |
P |
0.53 |
| 38 |
501 |
S |
505 |
Q |
0.53 |
| 39 |
502 |
R |
506 |
P |
0.53 |
| 40 |
499 |
F |
503 |
L |
0.53 |
Alignment robustness analysis
First most common residue correlation
Second most common residue correlation